Miquel Perello Nieto

Tutorial on Artificial Neural Networks
https://github.com/perellonieto/ann_notebooks
Perceptron training
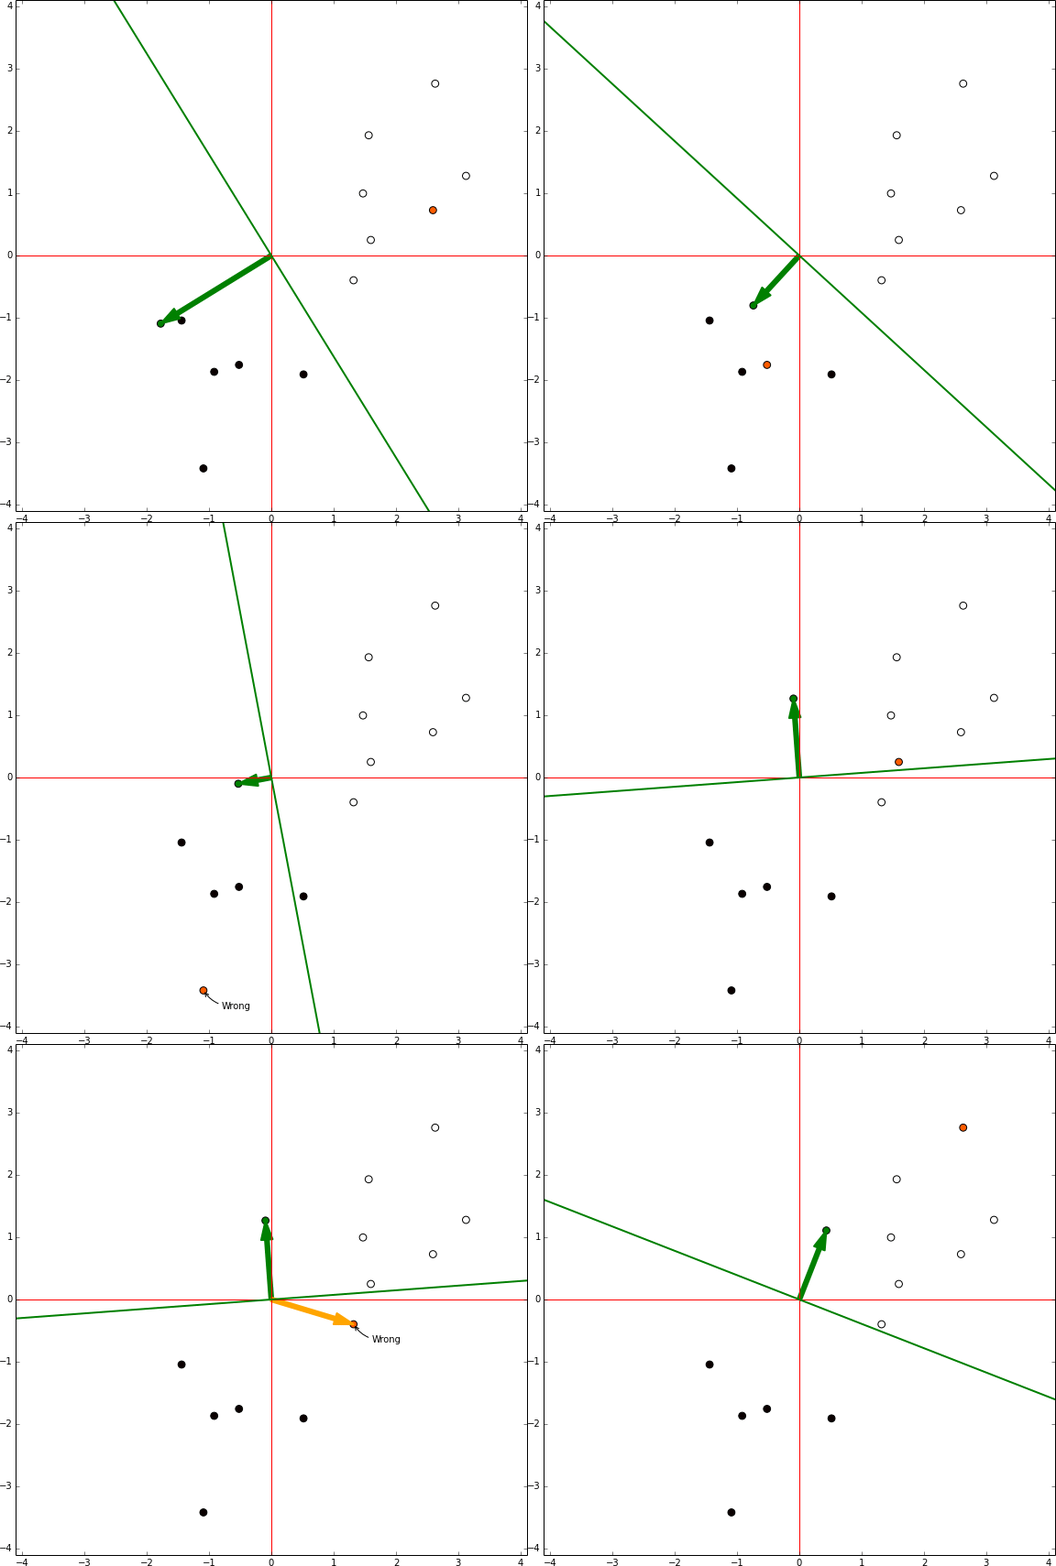
In this representation there is no bias involved, the green arrow are the model weights and it defines an hyperplane orthogonal to them centred in the coordinates [0,0]. In each iteration the sample being tested is shown in orange. If the sample is in the wrong side of the hyperplane the vector representing the sample is shown, then the red vector is the same vector reescaled by the learning rate and it is summed to the weights vector. Then, the next sample is tested.

Activation functions
Download this example here: activation_functions.ipynb
MLP Example: x
Download this example here: mlp_example_linear.ipynb
MLP Example: sin(x)
Download this example here: mlp_example_sin.ipynb it also needs this file mlp.py
MLP Example: sin(cos(x))
Download this example here: mlp_example_sin_cos.ipynb it also needs this file mlp.py
Generalization
Download this example here: generalization.ipynb
Error surface
Download this example here:
error_surface.ipynb
Or visualize it better here:
nbviewer